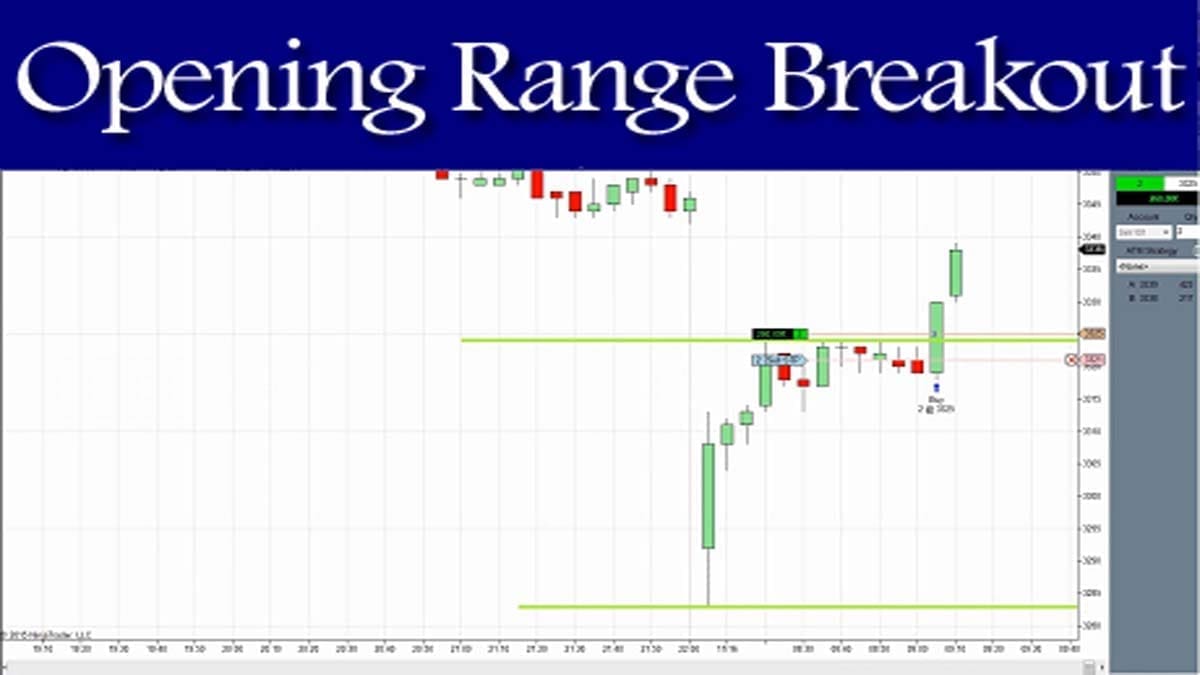
Opening range breakout (ORB) is one of the simplest day trading setups to understand. The first 15 minutes or the first half-hour, or the first hour of the trading day is the most volatile. Bears and bulls are battling it out in the stock market, trying to show you who’s going to be the boss for the day. This volatility creates a price range you can trade from. You can trade this opening range breakout. Like all breakout trading setups, this is a great setup because it offers a very low-risk entry.
Our Stockmaniacs team has created this advanced Opening Range Breakout Trader scanner, by which you can do trading so easily and profitably, and save lots of time.
Opening Range Breakout (ORB) Scanner
The table will auto-update itself every minute.
How to Use the Opening Range Breakout (ORB) Scanner
The Opening Range Breakout (ORB) Scanner helps intraday traders quickly identify stocks breaking out of their opening trading range. It monitors the 15-minute, 30-minute, and 1-hour opening ranges and highlights stocks showing bullish or bearish momentum.
Step 1: Understand the Opening Range
The opening range is the highest and lowest price during the initial market period after the market opens at 9:15 AM (IST).
The scanner tracks three ranges:
- 15m ORB → Range formed between 9:15 AM – 9:30 AM
- 30m ORB → Range formed between 9:15 AM – 9:45 AM
- 1H ORB → Range formed between 9:15 AM – 10:15 AM
These ranges act as key support and resistance levels for intraday trading.
Step 2: Identify Breakout Signals
The scanner displays breakout signals in three columns:
| Column | Meaning |
|---|---|
| 15m ORB | Breakout above/below the first 15-minute range |
| 30m ORB | Breakout above/below the first 30-minute range |
| 1H ORB | Breakout above/below the first 1-hour range |
Signals appear as:
- BULLISH Icon → Price broke above the opening range high
- BEARISH Icon→ Price broke below the opening range low
- – → No breakout yet
Step 3: Check Breakout Strength
The Strength column shows how many ranges were broken.
| Strength | Interpretation |
| 1 | Early breakout (only ORB15 broken) |
| 2 | Strong breakout (ORB15 + ORB30 broken) |
| 3 | Very strong breakout (ORB15 + ORB30 + ORB1H broken) |
Higher strength generally indicates stronger momentum.


Step 4: Watch Fresh Breakouts
The Fresh Breakout column (🔥 BREAKOUT) highlights stocks that just triggered a breakout.
Step 5: Confirm Before Trading
Before taking a trade, consider additional confirmation such as:
- Volume increase
- Market trend (Nifty / Bank Nifty direction)
- Support and resistance levels
- VWAP or moving averages
The ORB scanner is best used as a signal generator, not a standalone trading system.
Step 6: Open the Chart
Click any stock symbol in the scanner to open its TradingView chart instantly, allowing you to analyse the breakout visually before entering a trade.
Tips for Intraday Traders
- The first 15-minute breakout often signals early momentum.
- 30-minute and 1-hour breakouts are usually more reliable.
- Avoid chasing breakouts during low-volume periods.
- Always use a stop loss near the opening range level.
Data Update
The scanner updates every 60 seconds during market hours to provide near real-time signals.
What is the Meaning of Opening Range Breakout?
ORB is a well-known concept discovered by Toby Crabel. It is a variation of the classic N-bar breakout system. This concept is so widely talked about because it works. I will show you a new twist on the concept that is never discussed anywhere else.
What does the opening range breakout trading system do?
- It identifies the highest price and lowest price reached since opening up to the Start Time and also takes into consideration the range of the previous day.
- Long on a stop at the desired percentage and short on a stop at the desired percentage obtained in #1.
- Only trade once per direction, so at most 1 long and 1 short position taken per day.
- Always exit at the end of the day.
- When the range of previous trading sessions is above a certain threshold of the average range of the previous trading days, no trade is taken for the day.
Strategies to Trade the Open Range Breakout Setup Wisely?
As you know, this is a very powerful strategy. And many traders follow the strategy. Some traders follow the 15-minute open range breakout, some traders follow the 30-minute open range breakout, and some traders even follow the one-hour open range breakout. Our scanner covers all 3 ORB ranges, and you can follow as per your trading style
And you know that once the open range is broken, the market eventually tries to move in a single direction. Most of the time, you can see a single-direction movement till the market ends hours after the breakout occurs.
How to Execute Trade in the Opening Range Breakout Strategy
- Suppose I want to buy Reliance. I need to check the ORB breakout signals and the breakout strength. Once I get the buy signal, I can select the Buy order. You just need to click on the buy on your broker’s terminal.
- Now, if you want to buy the stock at the market price, then click on place order. You can decide the quantity and capital to invest in this trade.
- To avoid a sudden spike in the price, you can also put a limit buy order above the buy entry price. Similarly, we can put a limit sell order below the sell entry price.
- Lastly, once your order gets executed, check your execution orders in the position section.
More Information about ORB
You can see a person who can slip and fall down even if he walks inside his home safely; at the same time, another person balances his weight and walks on a rope tied between two buildings. Day Traders are like the man who walks on a rope. For every achievement, there are certain rules. Learn the Rules; never break your Own Rules. Be an achiever, whatever strategy you use. All the Best.
Conclusion
However, the interesting part is that the system is written in a formula and can be used for any stock, index, commodity, or forex with proper liquidity. Trading this strategy works best after the consolidation of the stocks. So you can find a stock that has gone through some consolidation, and the next day, its opening range breakout can trigger a one-sided move. You can find stocks with narrow-range CPR or Central Pivot Range indicators and apply this strategy to them. Narrow CPR indicates the stocks are going through a consolidation.